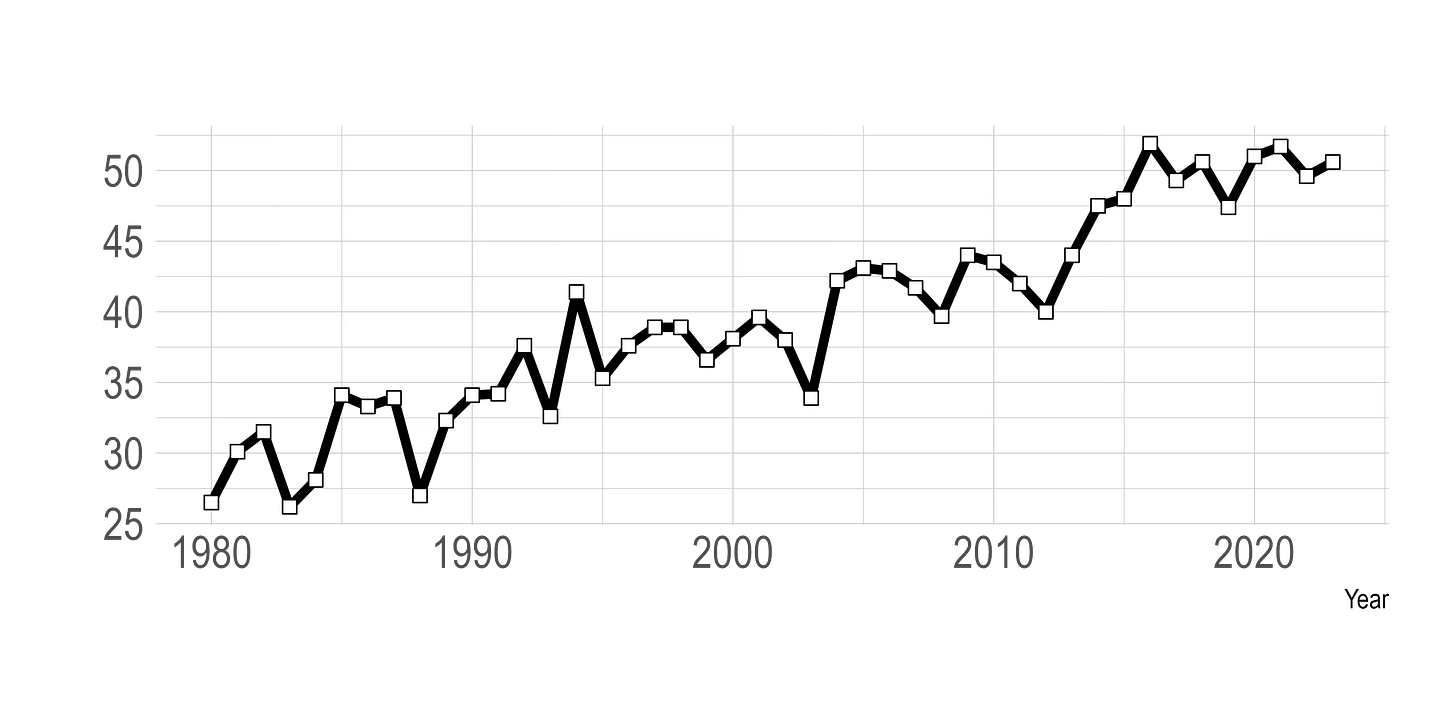
Soybean Yield Projections for 2024.
I'm starting with 51.8
Just as in my previous post about corn, a quick glance at national average yield for soybeans might lead one to believe that soybean yields have stopped increasing. The last record yield in the US was 2016 at 51.9 bushels/acre. Since then, we’ve exceeded 51 bushels/acre on two more times, but we’ve gone 7 years without a new yield record.
As with corn, the issue here is not breeding, or lack thereof, or traits, but weather. 2016 presented an excellent year for weather conditions for soybeans, and no year since then has matched it.
We are all aware that there are many factors that affect yield in any given field or farm. But as we aggregate to county, state, and national yields, differences in fertility, drainage, seed, even pest and disease pressure give way to the effects of weather.
Since 2013, the USDA World Agricultural Outlook Board has used a weather-informed model (Westcott and Jewison (2013) ) to project yields. This model has seen many variations applied by other analysts, including notably FarmDoc Daily of the University of Illinois. I used this model to estimate yields for corn for 2024.
                 estimate    s.e.    t-stat   p-value
(Intercept)	-1047.847    58.68   -17.86    <0.001
Year	            0.543     0.03    20.87    <0.001
lateplanted	   -0.040     0.02    -2.13	0.042
SepMarPrecip	    0.095     0.13     0.73	0.470
AprPrecip	    0.215     0.40     0.54	0.590
JunPrecip	    2.639     1.70     1.55	0.131
JunPrecip2	   -0.287     0.18    -1.58	0.124
JulPrecip	    2.943     1.82     1.61	0.117
JulPrecip2	   -0.274     0.20    -1.38	0.179
AugPrecip	    0.834     0.34     2.43	0.021
AprTemp	            0.041     0.11     0.39	0.700
MayTemp	            0.104     0.12     0.88	0.387
JunTemp	            0.471     0.17     2.76	0.010
JulTemp	           -0.402     0.16    -2.46	0.020
AugTemp	           -0.378     0.16    -2.35	0.026
When applied to soybeans, the power of the model declines a bit—it only explains 93.96% of the variation in yields compared to 95.57% as for corn. But 93.96% is nonetheless very good performance.
This model also allows us to estimate a weather-adjusted trend yield for 2024. Using these results, and without any data yet for 2024, the yield forecast for soybeans in the US is 51.8 bushels/acre.
Soybeans also exhibit continued annual average growth in yields—of 0.54 bushels/year. The factors that most significantly affect yields are late planting, August Precipitation, and Temperature in June, July and August. Winter precipitation (“SepMarPrecip”) has no clear statistical impact on yields when the other factors are included.
Over the past five years, we can see that for soybeans, in the years in which actual yield deviation from trend (the white line) were negative—2019 and 2022, late planting played a role in both. In 2019, Summer Precipitation largely offset the planting, while in 2022, it reinforced it.
Going forward, the next question is when does 2024 matter? In the past, evidence of the predictive power of planting progress reports was very limited until late April, and only then became substantial as May progressed. However, as we are now in the period in which planting progress is being released, we can update these models for the present date, and compare to the past to see whether current progress, or lack thereof, is enough to affect expected harvest yields.


