Why I'm Using 182.1 Bu/Ac in 2024
It's just math...
In many farmer meetings in late 2022 and early 2023, I heard increasing skepticism about the direction of corn yields. Farmers, agronomists, end economists wondered whether the lack of new traits and the continued expansion of corn and soybean acreage meant that corn yields were destined to plateau in the upper 170s until some new breakthrough came along.
These beliefs are paticularly problematic from a marketing perspective. When the first forecasts each year begin to emerge in the Winter and Spring before planting, doubt around forecasts of yields above 180 means that farmers with those views are likely to see the market as irrationally bearish, hurting their own marketing decisions.
Having worked in commodity analysis since 1995, and being a bit of a data nerd on top of that, this all piqued my curiousity. Have yields actually stopped, or paused growing? What is the effect of acreage expansion into marginal areas? If not in yield growth, have there been changes in yield variability or other characteristics of the trend in recent years? I’ve been working on these questions over the past six months, but some changes delayed my publication of the results. Over the coming weeks, I hope to fix that.
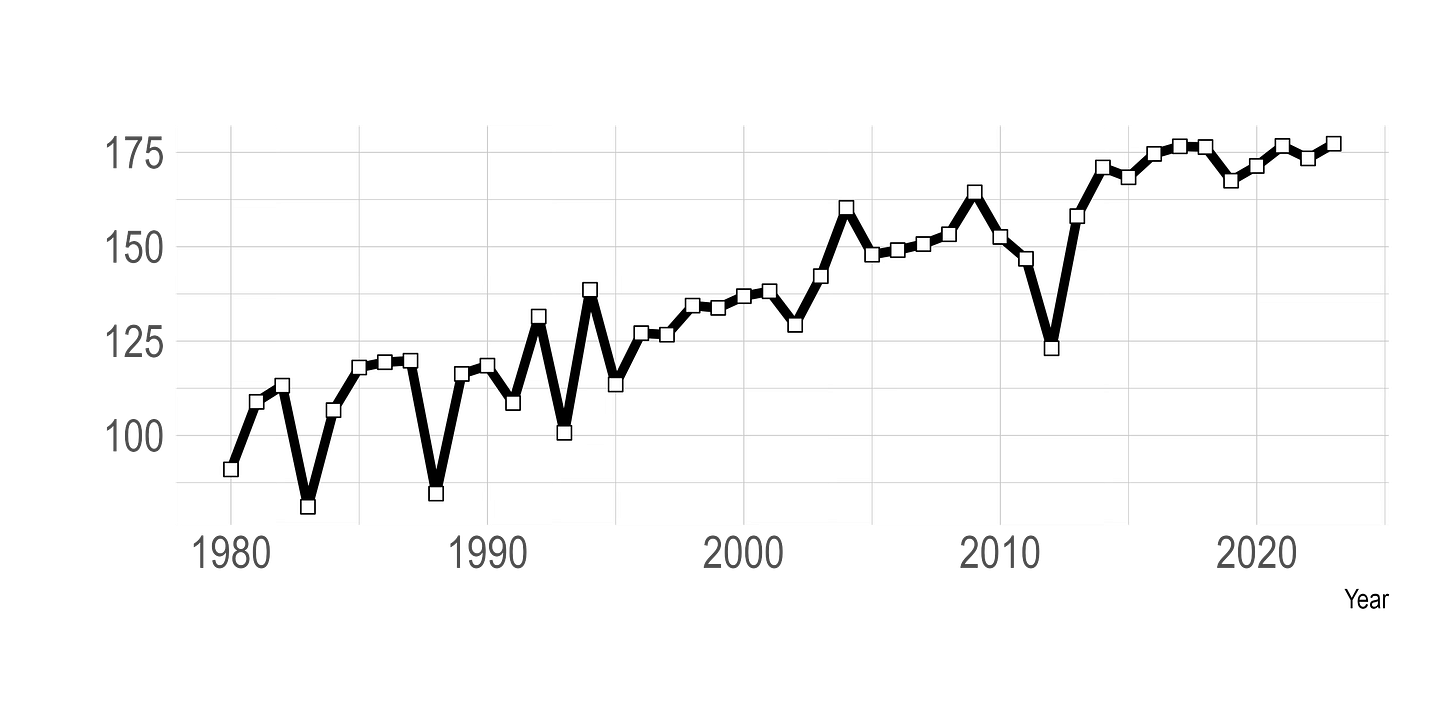
The source of the doubts about yield growth are pretty apparent. In 2014, US National yields first broke 170 bushels/acre, at 171. Since then, seven of the nine years have been betwen 171 and 177 bushels/acre, and graphically, yields do appear to have flattened out since 2016. While we’ve seen new records, even in 2023, they’ve been slight at best.
Starting in 2013, the World Agriculture Outlook Board has informed its yield forecasts with weather, using the model in Westcott and Jewison (2013). Since then, FarmDoc Daily has published a number of additional articles on the interaction of weather and national yields. The use of weather data provides an opportunity to dig deeper into yields over the past decade. Irwin (2023) estimates a relatively simple model of national average yield taking into the account of weather. Using the same weather data from the Midwestern Regional Climate Center and yield data from NASS, and estimating with data from 1980 to 2023 data yields the regression model of:
                 estimate     se.       t-stat	p-value
(Intercept)	-3631.097   130.64	-27.79	<0.001
Year	            1.954     0.06	 31.84	<0.001
lateplanted	   -0.345     0.09	 -3.99	<0.001
SepMarPrecip	    0.406     0.35	  1.16	 0.256
AprPrecip	    2.482     1.08	  2.30	 0.029
JunPrecip	    7.522     4.21	  1.79	 0.084
JunPrecip2	   -0.842     0.44	 -1.92	 0.065
JulPrecip	   31.054     4.45	  6.98	<0.001
JulPrecip2	   -3.330     0.49	 -6.84	<0.001
AugPrecip	    2.545     0.83	  3.07	 0.005
AprTemp	            0.097     0.30	  0.33	 0.744
MayTemp	            0.326     0.31	  1.06	 0.298
JunTemp	           -0.365     0.42	 -0.87	 0.390
JulTemp	           -2.227     0.41	 -5.44	<0.001
AugTemp	           -1.061     0.41	 -2.61	 0.014

Adj R^2: 0.9557
This is very similar to the results that Irwin obtained in the article referenced above. The R^2 (a measure of how well the explanatory variables ‘explain’ the independent variable, which is yield) is very high, and the overall model is very significant. The single most important number here is the estimate for ‘Year’ which represents the estimate of how much US national average corn yield is increasing each year, after adjusting for weather. This model shows an estimate of 1.954 bushels per year, and that estimate is very very statistically significant.
Figure 3 compares actual yields, as estimated by NASS each year from 1980 to 2023, and compares them to the weather-adjusted predicted yields. The blue line uses data from 1980 to 2015, before yields ‘flattened’ and the red line uses data through 2023. What we see from both models of yield is that including weather in the analysis shows that yields should have been lower since 2015. Further, when we compare the predicted yield based on 1980-2015 to that of 1980-2023, we see that given the actual weather in 2016-2023, the red line is higher than the blue, which indicates (doesn’t prove, just indicates) that in fact yields are becoming even more tolerant of adverse weather.
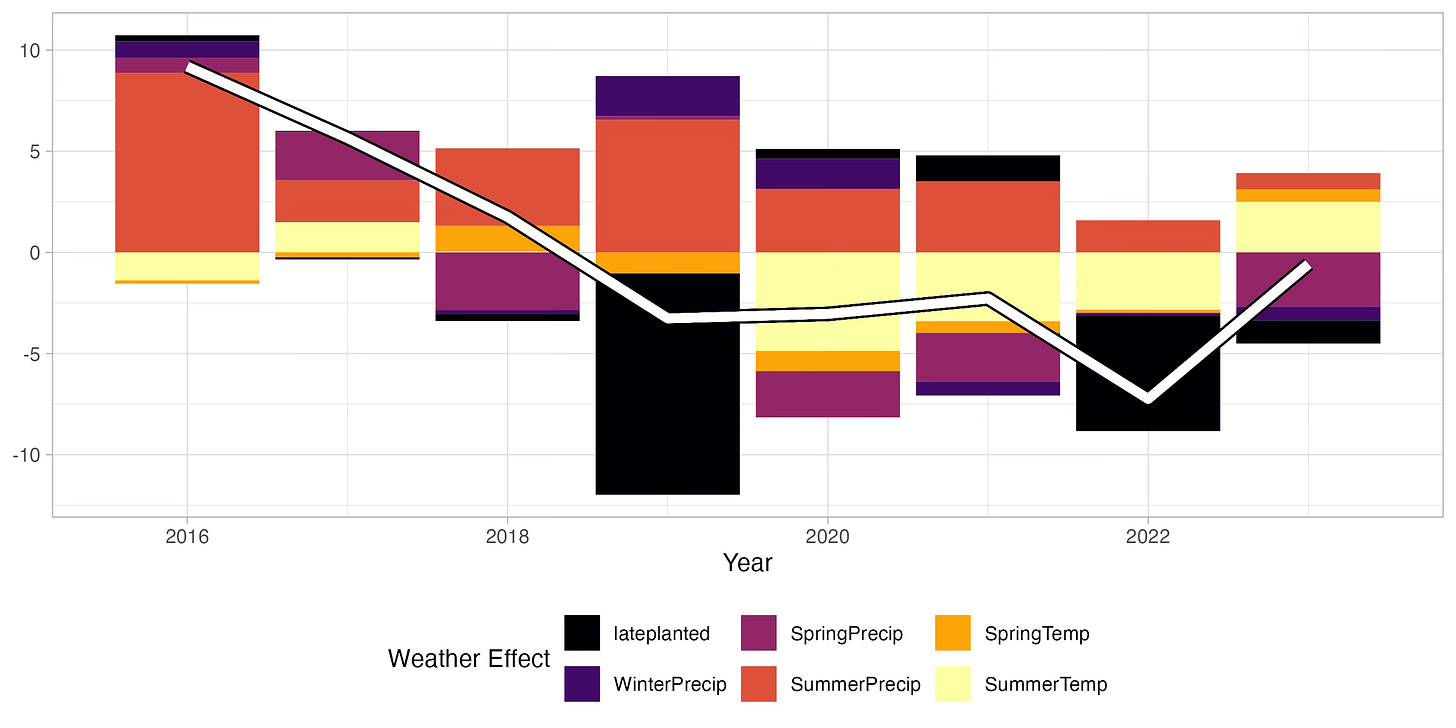
Figure 4 attempts to convey the impact of the different weather conditions on yield in each of the years since 2015 from the regression model above. To simplify the visual, I’ve combined a number of the different variables. We see, for example, that in 2023, on net, summer temperatures were actually a positive for yield, while spring precipitation and late planting were both negatives, and the effects of was largely offsetting. Note that just because the modeled yield in 2023 shows only -0.6 bushel change, there is still an idiosyncratic bit of the model, i.e. it’s not perfect. The very hot and dry conditions in the Western Cornbelt and the nearly perfect conditions in the Eastern Cornbelt aren’t easy to model without diving to the state level, which will be a coming post.
In 2022, the effects of weather were much clearer with large amounts of late planting, as well as negative summer temperatures resulting in yield that was 7 bushels below trend. When we look at the effect of weather across all of the past seven years, we see that not since 2018 would we have expected weather to actually increase yield.
Finally, for the punch line…what happens when we estimate yield for 2024? Well, we don’t yet have precipitation data for September 2023-March 2024, as in the model above—we should have it in the next week or so—but I arrive at an estimate of 182.1 bushels/acre assuming ‘average’ weather.


