We got the corn planted
As of June 3rd, planting progress still indicates trend line yields for 2024.
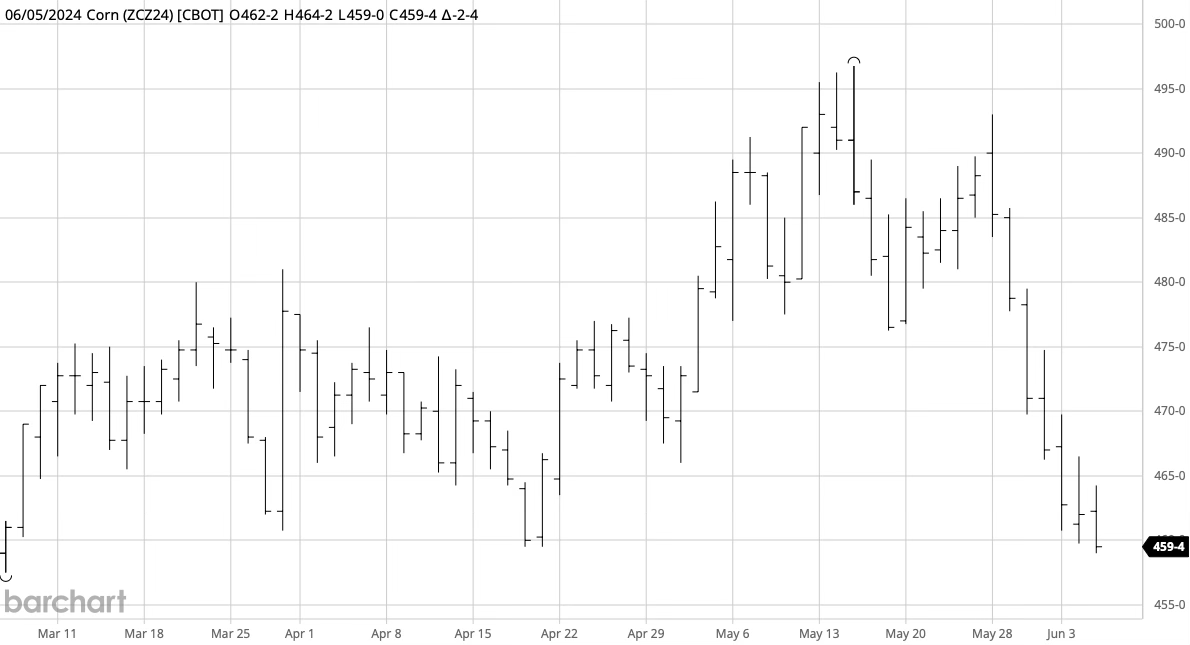
Many states (and farmers) worked through a wetter-than-normal late April and early May, enough that concerns grew about planting progress and the eventual impact on 2024 yields. New crop corn prices rallied from $4.60 to $4.95 between April 15th and May 15th.
During mid-May, weather patterns changed, and planting progress accelerated, resulting in prices giving back that rally in the weeks since May 15th.
Using the weather model for corn from this earlier post, I calculated the currently predicted yield by state using the most recent data available. I found two things: first, the planting rate doesn’t indicate any reason to be worried about yield this fall. Second, that while there are some differences between using the May 15 date recommended by FarmDoc and others to measure late planting, that date matters much more for Illinois, Indiana, and Iowa than others.
In the table below are projections of 2024 corn yield by state for the 10 largest corn producing states in the US. The first data column (June 3rd) is the projected yield using all of the data available as of the June 3rd, 2024 Crop Progress report, specifically, lateplanted, SepMarPrecip, and AprTemp for 2024 are used to calculate the projection, though the model is only estimated with data through 2023.
The column Jan 1st is the projection for 2024 yields by state ignoring what we know has happened so far in 2024.
                 2024 Yield            Prospective   Proj. Prod. (m bu)
        State  June 3rd  Jan 1st   se   Plantings   Jun 3rd   Jan 1st
      INDIANA   183.8     186.0   3.65     5100       948       937
     ILLINOIS   197.6     199.0   3.20    10900      2168      2153
         IOWA   202.9     204.0   2.76    12800      2611      2597
    MINNESOTA   196.1     197.2   4.51     7900      1557      1549
     MISSOURI   162.7     156.8   4.53     3500       548       569
     NEBRASKA   189.8     189.5   2.26     9850      1866      1869
 NORTH DAKOTA   137.6     140.0   7.20     3800       532       523
         OHIO   187.2     183.2   4.08     3300       604       617
 SOUTH DAKOTA   165.0     163.3   3.65     6000       979       989
    WISCONSIN   177.6     178.9   3.61     3800       679       674
        Total   186.4     186.7   n/a     66950     12498     12481
As you can see, the differences this year between the Jan 1 and the June 3 models aren’t large, particularly when compared to the standard error of the model, which is an estimate of the variability of the prediction. In general, the only state that so far exhibit more than one standard error of difference is Missouri, though Ohio is within a hair (0.08 standard errors) of doing so. (Is it a coincidence that these are the only two states in this list I’ve lived in?)
When we add the acreage estimates from the March 31st Prospective Plantings report, and then calculate the net effect on production, we get a similar story, with very small differences. In the total bushel calculation, it is also easier to see that the changes largely cancel out, for only a total of 18m bushel greater forecast production for these 10 states.
So, to summarize, from what we know so far, we are still on track for a trend line yield in the US for corn. In future posts, I’ll run the same analysis for soybeans, and present what it means for my balance sheets for both crops.

